![]()
“Lies, damned lies, and statistics” is part of a phrase attributed to Benjamin Disraeli and popularised in the United States by Mark Twain: “There are three kinds of lies: lies, damned lies, and statistics.” The statement refers to the persuasive power of numbers, the use of statistics to bolster weak arguments, and the tendency of people to disparage statistics that do not support their positions. (Wikipedia)
Two recent speeches by the RBA supported the contention that Australian house prices are no longer overvalued, that mortgage repayment costs have returned to historic averages, that Australia is suffering a housing shortage, and therefore that the Australian housing market should not experience the catastrophic falls that are now commonplace across the OECD–and especially in the USA.
Ric Battellino’s speech to the Urban Development Institute of Australia (An Update on the Economy and Financial Developments) gave no data, but was optimistic about the future prospects of the housing sector. The data supporting this optimism was supplied in a speech by Anthony Richards to the 4th Annual Housing Congress (Conditions and Prospects in the Housing Sector).
Though Richards acknowledged that prices had fallen somewhat in 2008, he emphasised that this was less than had been experienced overseas. He also hypothesised that our market would not suffer similar falls in the future:
there are a number of reasons to think that outcomes here might remain better than elsewhere. These relate both to the role of policy in responding to the downturn and the consolidation of household finances that has occurred in Australia since our housing boom slowed earlier in this decade, around the end of 2003.
Two key pieces of evidence Richards presented were the following graphs. The first compares current mortgage repayments to a “long run average” that was based on data from June 1986 until now.
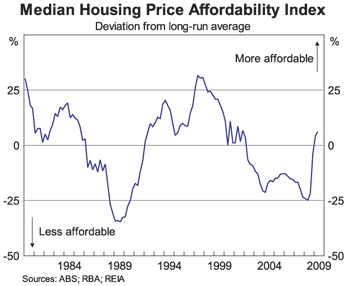
On this indicator, a house purchase is currently about 15% more affordable than the long term average (the dot on the graph estimates current affordability after recent rate cuts).
The second graph shows the ratio of the median dwelling price to household disposable income, again with a comparison to the average (this time from 1993 till now).
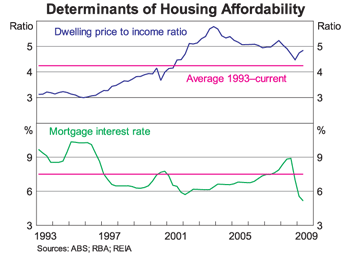
From this perspective, housing was not quite as affordable when compared to historic averages as the above measure implies, (since the former includes the impact of today’s very low interest rates whereas the latter does not). But it was still only marginally above the historical average, and Richards surmised that the rising trend up till 2003 may have reflected the transition to a lower inflation environment:
In addition to mortgage rates, the second determinant of standard affordability measures is the ratio of housing prices to income. At present, this ratio remains slightly above its average over the low-inflation period (Graph 3). Of course, there may be good reasons for it to have experienced a trend increase over recent decades as the economy adjusted to a structural shift to lower inflation.
Richards’ overall conclusion was that, on the statistics, Australian house prices were not overvalued,
… it is noteworthy that the housing price to income ratio has declined significantly since its peak in late 2003. Over the period since end 2003, nationwide house prices have grown on average by 4 per cent per annum, versus annual growth of 14 per cent in the prior five-year period. And the growth rate of house prices in the past five years has been well below the 8 per cent average annual nominal growth in household disposable incomes.
So the price-income ratio, a frequently used – but crude – measure of housing price valuation suggests that any overvaluation of housing prices has eased significantly since the Australian housing boom slowed significantly in late 2003. Since then, households have had significant income growth, but that growth has flowed only to a modest extent into housing prices.
Richards expressed some reservations about the degree of undersupply of housing in the Australian market, but overall agreed with the common assessment that the relative shortage of housing supply would place a floor under the Australian market, in contrast to the oversupply situation in the USA:
“Whatever the true shortfall of dwellings, we can say with some confidence that our housing market is relatively tight. This can be contrasted with the US market which many observers characterise as having been subject to overbuilding during their housing boom. And the relative tightness of the Australian housing market is one factor that will support home-building in the period ahead.”
His conclusion supported the belief that, even though a recession will occur, the housing sector will not suffer price falls like those that are commonplace overseas, nor will problems with housing exacerbate the recession itself. If anything, the housing sector should boost the wider economy rather than drag it down:
First, the recent significant falls in the cash rate are having positive effects on the economy and the household sector, and have contributed to a significant improvement in household cash flows and in measures of housing affordability for people paying mortgages or contemplating home ownership. Second, although home-building is likely to remain weak in the near term, there are a number of factors which should support activity over the medium term, providing stimulus to the broader economy. Finally, when one looks at the behaviour of the household sector over the past five years – in particular the trends in housing prices, and household income, spending and borrowing – it is evident that there has been a significant degree of consolidation since the housing boom slowed in 2003. This will reduce the vulnerability of the household sector in the current slowdown.
Richards analysis, along with Battellino’s implicit endorsement of its conclusions, was picked up by commentators like Alan Woods in “Housing damage won’t be drastic” (The Australian, April 03):
Now, of course, we have the worst global recession since the ’30s and an international credit crisis, but an authoritative analysis last week by Anthony Richards, the Reserve Bank of Australia’s resident housing expert, highlights several important reasons for expecting Australian housing prices to perform better than in many other countries.
Woods was reassured by the reported fall in “the ratio of housing prices to income, … Richards says this suggests any overvaluation of housing prices in the boom years also has eased significantly”, and his qualified endorsement of the argument that house prices will be buoyed here by “the gap between housing supply and demand as a result of a rapidly growing population.” However on the latter point, Woods noted that “a shortage of housing hasn’t stopped a crash in prices in Britain”.
Overall, while he emphasised that Richards’ speech provided “an impressive list of positives”, he felt that the recession would still come out trumps: “the most likely outcome is at best a period of stagnating house prices, with a real risk of a fall, albeit a far more modest one than in the US and Britain.”
Now, in the spirit of Benjamin Disraeli, let’s take a slightly more critical look at the numbers–starting with the comparison of the median house price to income.
House Prices to Income
The footnote to Richards’ Graph 3 states that the figure used for average household disposable income was “after tax and before the deduction of interest payments”. This is curious, since the RBA’s own measure of household disposable income is after the deduction of interest payments (see RBA Bulletin Table G12 and the Notes).
The average line Richards drew on Graph 3 is also curious, since it is an average since 1993. This may reflect how long a time series for the median house price that the RBA got from the Real Estate Institute of Australia, but it would not have taken much effort to combine this with the ABS’s median house price indices and provide a house price to disposable income calculation that went back to 1987. That is done in the next Figure–using index numbers since I don’t have access to the REIA’s median house price data.

This Figure paints a very different picture of the current house price to income ratio.
Firstly, there are now “twin peaks”: unlike the RBA’s modified house price to disposable income ratio that peaked in 2004 and clearly fell thereafter, the highest value of this ratio was in January 2008. So on this measure, Australia’s house price bubble did go off the boil a bit in 2004, but it went right back on again in 2006. Rather than our house price adjustment starting before America’s, on this price to income comparison our bubble continued well after the acknowledged bursting of the US bubble in mid-2006.
Secondly, rather than the current value being just a smidgin above the 93–09 average, it’s 27% above it–and it’s one third higher than the “long term average” from 1987 till now.
So which ratio is more valid here–one derived prior to the payment of interest (Richards), the other derived after it? A case could be made for either: if you’re contemplating buying a house, then you’re contemplating taking on a interest payment burden (and principal repayment burden) that you don’t currently have; but on the other hand, you might be substituting rental payments (out of disposable income) for interest+principal payments.
So it could be seen as a judgment call as to which to use–in which case, for objective presentation of the data, you should present both.
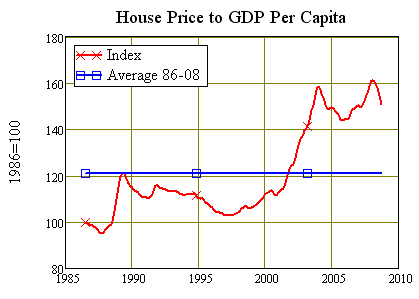
Or perhaps use a few more indicators to decide which one, on balance, gives the more accurate picture. For example, here’s the ratio of the median house price index to GDP per head. It is currently 25% above the 86–08 average, and the second peak in early 2008 is 1.65% higher than its 2004 predecessor.
It’s also no secret that income has been massively skewed in favour of profits rather than wages in the last few decades. So how about a comparison of the house price index to average weekly wages (ABS 630203, Column J), which is a fairer analysis of how expensive housing is for the average family of workers?. This is currently 43% above the 86–08 average:

There are those pesky Twin Peaks again, and once more the second (in March 2008) is higher than the 2004 one the RBA prefers to see as the peak of the housing bubble–this time a substantial 9% higher, reflecting the continuing erosion in workers’ incomes over the last decade.
Certainly, it’s not possible to make a conclusive statement that 2003-04 marked the peak of the Australian house price bubble, as RBA officials have done on many occasions, nor can it be said that household affordability is now back at the “long term average”.
Which raises the next question: just how “average” was the 1986–2009 period, in the long sweep of Australian history?
House Prices over the really long term
The ABS has only maintained a comprehensive index of Australian house prices since mid-1986–a time when the hills were alive to the sound of Alan Bond and Christopher Skase. House prices rose 60% in the first three years of the index, far above the rate of inflation at the time. They then stalled for the next few years before more than tripling over the next 17 years–again, a rate of growth that far exceeded the rate of inflation. This 30-year-plus experience of continuously rising prices has helped shape the belief that house prices “always” rise faster than consumer prices.

But “always” is a much longer time span than a mere 30 years–something Robert Shiller appreciated when he and Karl Case developed the index of US house prices now known as the Case-Shiller Index. The key comparison Shiller makes is between house prices and consumer prices; this is the premiere indicator of the American market, and there it’s clear that the bubble has popped.
If we take a 25 year view, like that which Richards used in his paper, it could be argued that the fall in the index has almost brought the real price of American housing back to the average. Having plateaued at a value of 217 between 2005 and 2007, it has now fallen to 138, which is just 11% above the 85–09 average.

But if we look at the really long term–over the whole data set from 1890 till now–it’s apparent that the American market has some way to fall before it hits the average: even though it has already fallen 30% from its peak, it still has another 46% to go, if the real price of housing is constant over the long term.

That’s an if to which Shiller gives an emphatic “yes” to, based partly on his own data–which shows no trend to rising real house prices prior to the current bubble that clearly began in 1997–and partly on a yet longer term series still: the “Herengracht Index” that shows the real price of housing on a famous canal in Amsterdam over the three and a half centuries from 1628 till 1970. This index has at times risen for extended periods–such as over the 7 decades between 1814 and 1887 when the real price of a house on the Herengracht Canal rose almost fourfold. Anyone born at the beginning of that period could have easily been persuaded that house prices “always” rise faster than consumer prices.
But over the long term, there is no trend. For the next 7 decades, house prices tended down in real terms: the index fell 55% from the 1887 peak to be 40% below the long term average of 198 in 1951, when yet another upward trend occurred.

Could a similar proposition apply to Australia? Dr Nigel Stapledon set out to answer this question in his PhD, where he observed that:
The period since the early 1970s has been one in which house prices have risen quite significantly by any measure with the median capital city house prices in Australia having risen on average 3% per annum in real terms in the period 1970–2006. While the rises in Australia have been above the average for developed countries, the picture is similar in most OECD economies and Australia is by no means unique.
The question that can be asked is whether this period is unique for housing? Eichholtz (1997) has constructed a long term series for Amsterdam in Holland which spans the period 1628–1973. The broad picture that his time series paints is one of prices essentially showing no trend for three centuries, with cycles related to the economic events. Against that long term perspective the post 1970 rise in house prices in Holland stands out. But one city is probably not convincing…” (Stapledon 2007, p. 1)
Stapledon’s key data table gave the median capital city house price in current dollars, 2005 dollars, and 2005 dollars deflated by 0.6% p.a. to reflect increasing house quality. In the following graph I take Stapledon’s CPI and quality deflated index, extended to today using the last 2 years of ABS data deflated by the CPI. I then set the value to 100 in 1890 to enable easy comparison with the Case-Shiller real house price index for the USA.

One inference from this graph is that the recent Australian house price bubble began earlier at much the same time as the USA’s (1997), but began from an already higher base that can be dated back to the 1987 Stock Market Crash.
At that time, the Australian index was only marginally higher than the USA’s–132 for Australia versus 120.5 for the USA, a 10% difference. But the 25% fall in the Australian stock market on Black Tuesday ended the Antipodean flirtation with stocks, and we piled right back into our favourite speculative play: bricks and mortar. Most of the money borrowed by Australian households for speculative purposes then drove up house prices, whereas Americans spread their leveraged dollars between stocks and houses.
As a result, Australian house prices absorbed most of the speculative excess of the last thirty years, driving them to 3.5 times the long term average versus “just” twice the average in the USA.
Of course, it could be true that, as the property lobby keeps asserting, Australia is “different”, and trends that don’t exist elsewhere in the world rule in the land of the marsupials. Especially since virtually everyone now describes this crisis as “the worst since the Great Depression, it would have helped if the RBA had referred to this publicly available data when preparing its own comparison of current house prices to “long term” trends.
The Never-Ending UnderSupply Story
Richards did express some scepticism here on behalf of the RBA that Australia’s undersupply of housing was as marked as some commentators claim, but he still came down on the side of this widely shared belief:
“Whatever the true shortfall of dwellings, we can say with some confidence that our housing market is relatively tight. This can be contrasted with the US market which many observers characterise as having been subject to overbuilding during their housing boom. And the relative tightness of the Australian housing market is one factor that will support home-building in the period ahead.”
Curiously, one group that does not share this belief is Hometrack, the local branch of the UK housing intelligence research group. Just days after Richards’ speech, it released a press release in which it stated that:
the widely quoted views of many property market commentators who believe that Australia’s current building levels are not enough to meet the future demand for housing, may be based on inaccurate data calculations.
“Our analysis indicates Australia may already have an excess of housing. We estimate there are at least 10 million dwellings in Australia compared with ABS data showing occupied dwellings of 8.3 million. The extra one to two million dwellings consists of a mixture of housing awaiting sale or development, vacant dwellings, second homes, and abandoned homes,” he said.
He went on to say that the ABS method for calculating the ratio of people per dwellings is based on ABS census data which in turn is based upon occupied dwellings. However, he said, Hometrack analysis which is based on postal address data indicates that Australia’s current level of housing relative to its population is in line with other Anglo economies.
Following on from this, Darcy said that when looked at in the context of population growth, total residential building approvals have been running above demand.
“This points to a build-up of excess stock of housing over the past six years, despite the gap between building approvals and demand narrowing over recent months,” he said.
“The concern is that business and government decisions regarding the residential housing market in Australia are being made based on demand assumptions that differ from the actual behavior of the housing market. There will always be examples of areas with an undersupply, but it’s not clear from the data that we have an overall shortage relative to future demand.”
Similar views have been expressed on contrarian blog sites like Bubblepedia, Homes4Aussies, etc.; this is the first time this claim has been made by a commercial property research group. The claim that there are up to 2 million unoccupied houses in Australia may appear extreme, but that is the size of the gap between the number of houses that the ABS says are occupied (8.3 million) and the 10,150,000 street addresses in Australia Post’s PAF database. However, many of these are business addresses, holiday homes and the like. On the other hand, the ABS found that 800,000 private dwellings were unoccupied on Census Night 2006–close to Hometrack’s bottom estimate of 1 million unoccupied dwellings in 2009.
So how valid is Hometrack’s claim? One way to assess this is to look at the growth of population in Australia, and compare it to the growth in the number of dwellings. If this ratio was substantially above the ABS estimate of the average number of persons per occupied dwelling, then the undersupply thesis would be confirmed and Hometrack would be off-track.

Whoops. Over the period 1985–2009, an average of 1 residential dwelling was built per 1.75 new Australians, and only in the last 3 months has the rate of new building fallen behind population growth. This build rate is well in excess of the current ABS ratio of 2.55 persons per occupied dwelling. Only if 30% of new dwellings involved the demolition of existing properties–an improbably high number–would the rate of supply of new dwellings be running behind the rate of growth of population.
Far from having an undersupply of housing, Australia may well have a substantial oversupply. It’s just that no-one is living in many of them.
So what could these unoccupied residences be? Holiday homes? Some, of course, but surely not all of them. It is far more likely that many of these include “housing awaiting sale or development,” and “vacant dwellings”, as Hometrack put it.
A very likely cause of this large stock of unoccupied homes is Australia’s system of negative gearing. Most “investors” build houses not for the rental income, but for capital gains, and rental returns in Australia are now so low that for many investors, the drawbacks of renting–damage to property, having to manage tenants, etc.–are not worth the rental income. Better to keep the property off the rental market, and claim the loss against tax. The under-supply of housing to the rental market, and the alleged shortage of properties for sale, could be a perverse result of Australia’s peculiar property development laws.
This implies that the market dynamics could turn out to be very different than those who believe there is an oversupply expect. If prices start to fall substantially, then many owners who have kept their properties off the market may be motivated to bring them out of mothballs. The “undersupply” of both rental properties and houses for sale could thus evaporate, and rather than supply issues putting a floor beneath house prices, they could well pull the rug out from underneath them instead.
A final issue considered only tangentially by Richards, but vital to the question of whether “the forces of supply and demand” will prop up Australian house prices, is leverage.
Exit, Stage Down
In defending the dominant view that Australian house prices are justified by supply and demand, Richards observed that:
“the relatively high level of housing prices in Australia is to a large extent a reflection of demand and the collective decisions of households. That is, housing prices have not been set at high levels by some external force. They are at their current levels because buyers in aggregate – with their incomes, preferences, access to finance, and other influences – have been willing to pay those prices.” (Richards; emphasis added)
This is a fairly typical piece of neoclassical economic thinking: prices reflect the interaction of supply and demand, and are therefore justified. In most markets, there’s not much wrong with this way of thinking; but there’s something unique about housing. You don’t take out a loan to buy the groceries, but you do to buy a house. What therefore will happen to demand if lenders become less willing to provide “access to finance”?
While the boom was on, loan to valuation ratios (LVRs) were rising; now they are falling as credit standards tighten. Though average LVRs are of the order of 50%, it’s the marginal LVR that matters, since that’s the source of leverage for new buyers. Accurate data on this isn’t easily available, but the impact of a drop in leverage can be dramatic. A fall from 95% to 90% in the maximum LVR a lender approves will halve the amount of money that a buyer can bid for a property.

Economists who apply a standard “supply and demand” mindset to analysing the property market seem to consider that demand can shift “left and right” as the volume of buyers falls and rises with time; but they seem to ignore that the “demand curve” for housing can shift up and down as well, in response to the willingness of lenders to increase or decrease their LVRs. A substantial fall in LVRs to new buyers could thus reduce the price that would-be buyers can offer, even if there was a physical shortage of properties.
Conclusion: Safe as Houses?
The data in support of the belief that Australian house prices will not suffer during the forthcoming recession is therefore nowhere near as conclusive as Richards’ speech implies. The price index might well be driven higher in coming months by the artificial stimulus imparted by the doubling of the First Home Buyers Grant (see FHB Boost is Australia’ s “ Sub-prime Lite”); but the downside risks to Australian house prices could be every bit as big as those that apply in other OECD nations.
Australia is not therefore justified in being “relaxed and comfortable” about house prices, despite the RBA’s assurances to the contrary.
This would not be an issue were the RBA simply another property market advocate: it’s common practice for both sides of the property market to quote data that supports one side and ignore the other. However, the RBA is not supposed to take sides in this debate, but instead to set monetary policy in the best interests of Australia as a whole.
I have argued consistently that, in common with Central Banks throughout the world, the RBA has failed in this task because it has followed an economic philosophy–known as “neoclassical economics”–that is fundamentally flawed. But this is something that, in some ways, the RBA can’t really be held accountable for: its economists are simply a product of academic economics departments around the world, and since these are dominated by neoclassical economists, most graduates are not going to know that there is any other way to think about the economy.
However when it comes to statistics, the RBA should play the role of honest broker rather than advocate. Its monthly Bulletin Statistical Tables provide a valuable resource. I believe its time would be better spent in developing robust, long term statistics on the housing market than in presenting selective data like that given in this speech.
END OF COMMENTARY
Comments on Data
The latest set of figures imply that the Great Deleveraging is well and truly underway. Aggregate private debt rose by a mere $326 million in the last month, with only mortgage debt turning in a positive–and were it not for the FHB Boost, the aggregate debt level would certainly have fallen.
Table One

Table Two

While debt levels have to fall, this process will necessarily cause a dramatic blowout in unemployment. Since our economy became so utterly debt-dependent, the contribution that rising debt makes to aggregate demand has come to dominate changes in economic activity and unemployment. The recent “larger than expected” increase in unemployment will become a recurrent phenomenon this year, as the change in debt starts to reduce aggregate demand rather than increase it.

In this respect, we are not so much different to the USA as merely running behind it in time. The explosion in unemployment that has virtually doubled unemployment there in the last two years will occur here, and possibly at an even faster rate.

As in the USA, what the authorities are interpreting as a liquidity crisis is actually a solvency crisis. Debt levels are now so high that the only way is down, and there are no other groups who can be encouraged to take on yet more debt and thus pull us out of this crisis as household borrowing did when it brought “the recession we had to have” to a close.

Now the only way forward is via deleveraging, and the great danger is that this will occur in a climate of falling prices–deflation–as well as falling output. This process could drive aggregate debt to GDP levels even higher–as it is now doing in the USA: there the ratio of debt to GDP is rising sharply, even though the rate of increase of debt has dropped. Fisher’s Paradox–that the attempt to reduce debt levels can actually cause debt levels to rise–is now with us once more. The world is paying a terrible price for listening to Milton Friedman and ignoring Irving Fisher and Hyman Minsky.

